The report builder answers questions the dashboard doesn't, such as average pallets per carrier last month or every gate event for one haulier. You pick a dataset, choose what to show, then run it. You can save the report, export it, or have it e-mailed on a schedule.
Build and run a report
Open Reports in the menu.
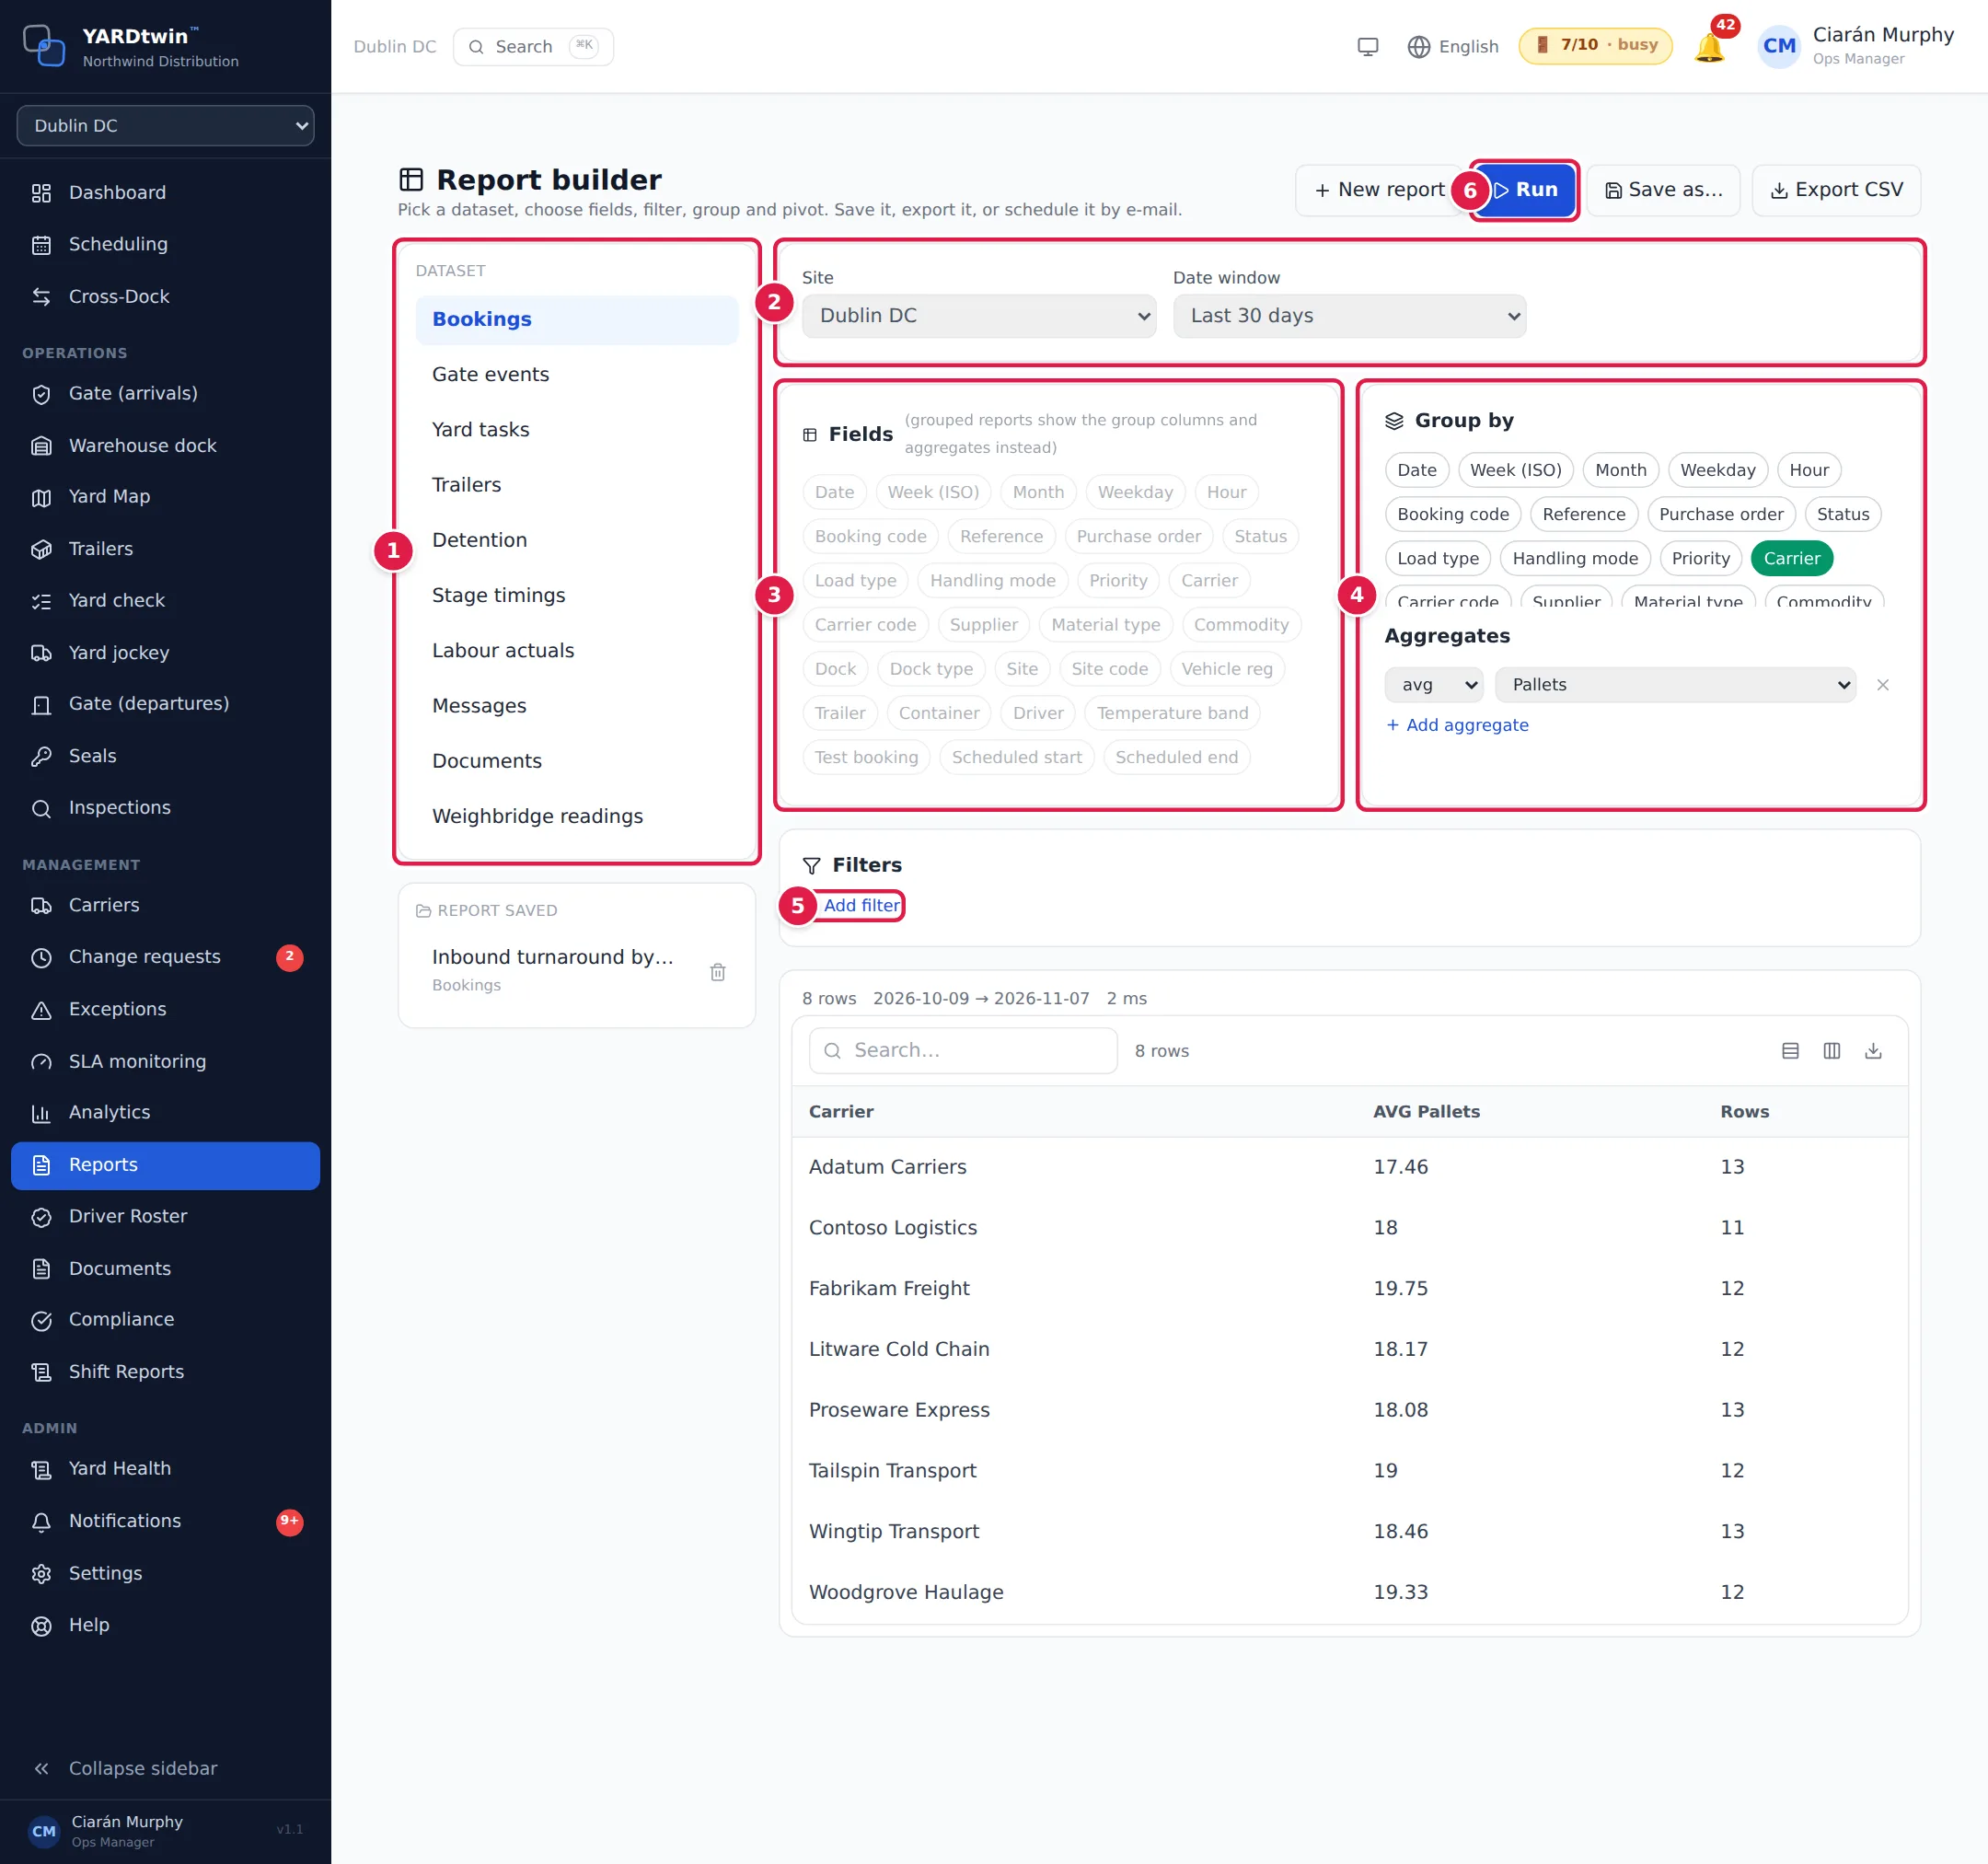
- Pick a Dataset on the left. Each one gives one row per thing:
- Bookings, with carrier, dock, site and the same timing measures as the dashboard. Its On time (1/0) field is 1 for a completed visit whose truck arrived no more than 15 minutes after its slot started, in the site's time, as on the dashboard's On-Time Arrival % tile.
- Gate events, one per check-in or check-out.
- Yard tasks, one per yard move.
- Trailers, with current location and dwell.
- Detention, one per detention record.
- Labour actuals, planned against actual person-minutes.
- Messages, one per e-mail, text or WhatsApp sent.
- Documents, with verification state.
- Weighbridge readings, one per weighing.
- Audit log, one per audit entry. Only administrators and QA see this dataset.
- Choose the Site (or All sites) and the Date window, for example Last 30 days, Last month or Custom… with your own From and To dates.
- For a list, click the Fields you want as columns. Click a field again to remove it.
- For totals instead, click one or more fields under Group by, then Add aggregate and choose a calculation (count, sum, avg, min or max) and the measure, such as Pallets. With two groupings, you can also Pivot (turn one group into columns).
- To narrow the rows, click Add filter, choose a field and a test (such as =, contains, between or is empty), and type the value. For in list or between, separate values with commas.
- Click Run.
The results appear underneath, with the number of rows, the date range used and how long the query took. The preview shows up to 200 rows. You can search and sort them, and the download button above the table exports what's on screen as CSV, Excel or PDF.
New report clears everything and starts again.
Save a report
- Click Save as… and type a name.
- Click Save.
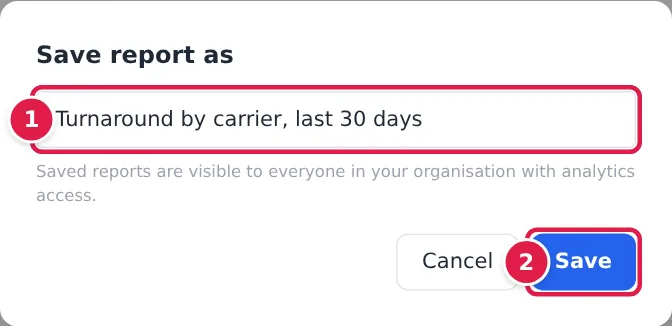
Saved reports appear in the list on the left. Click one to open it, change it, and click Save again. The bin icon deletes it. Any schedule that uses it is paused.
Saved reports are visible to everyone in your organisation who can open Reports.
Export the full result
Open a saved report and click Export CSV. This downloads the whole result (up to 5,000 rows), not just the 200-row preview. If the report isn't saved yet, the Save report as box opens first. Viewers can't save, so for them Export CSV works only once a saved report is open.
E-mail a report on a schedule
Open a saved report from the list on the left, then click Schedule…. Only administrators see Schedule….
- Choose the Cadence: Daily, Weekly or Monthly.
- Type the Recipients' e-mail addresses, separated by commas.
- Leave Attach the full result as CSV ticked to get the data as an attachment.
- Click Create schedule.
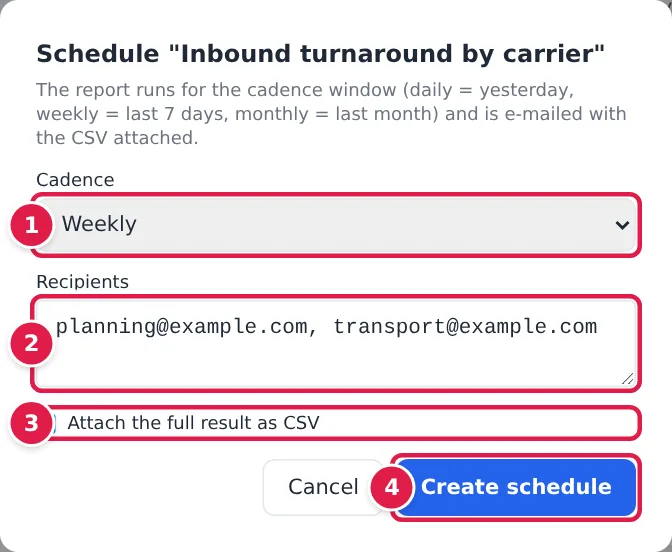
Each run covers the period just finished: yesterday for daily, the last 7 days for weekly, last month for monthly. YARDtwin shows Scheduled — the first e-mail goes out on the next run. To see or stop schedules, see Scheduled reports.
Who can do what
- Administrators can build, run, save, delete, export and schedule reports.
- Ops managers, yard managers and QA can build, run, save, delete and export reports. They don't see Schedule…: ask an administrator to set up the e-mail.
- Viewers can build and run reports, and export saved ones. They don't see Save, Schedule… or the bin icon.
The Analytics overview
The Analytics page is a ready-made summary for one site, with no setup. Open it with Management → Analytics in the menu (just above Reports), or press Ctrl + K and type analytics.
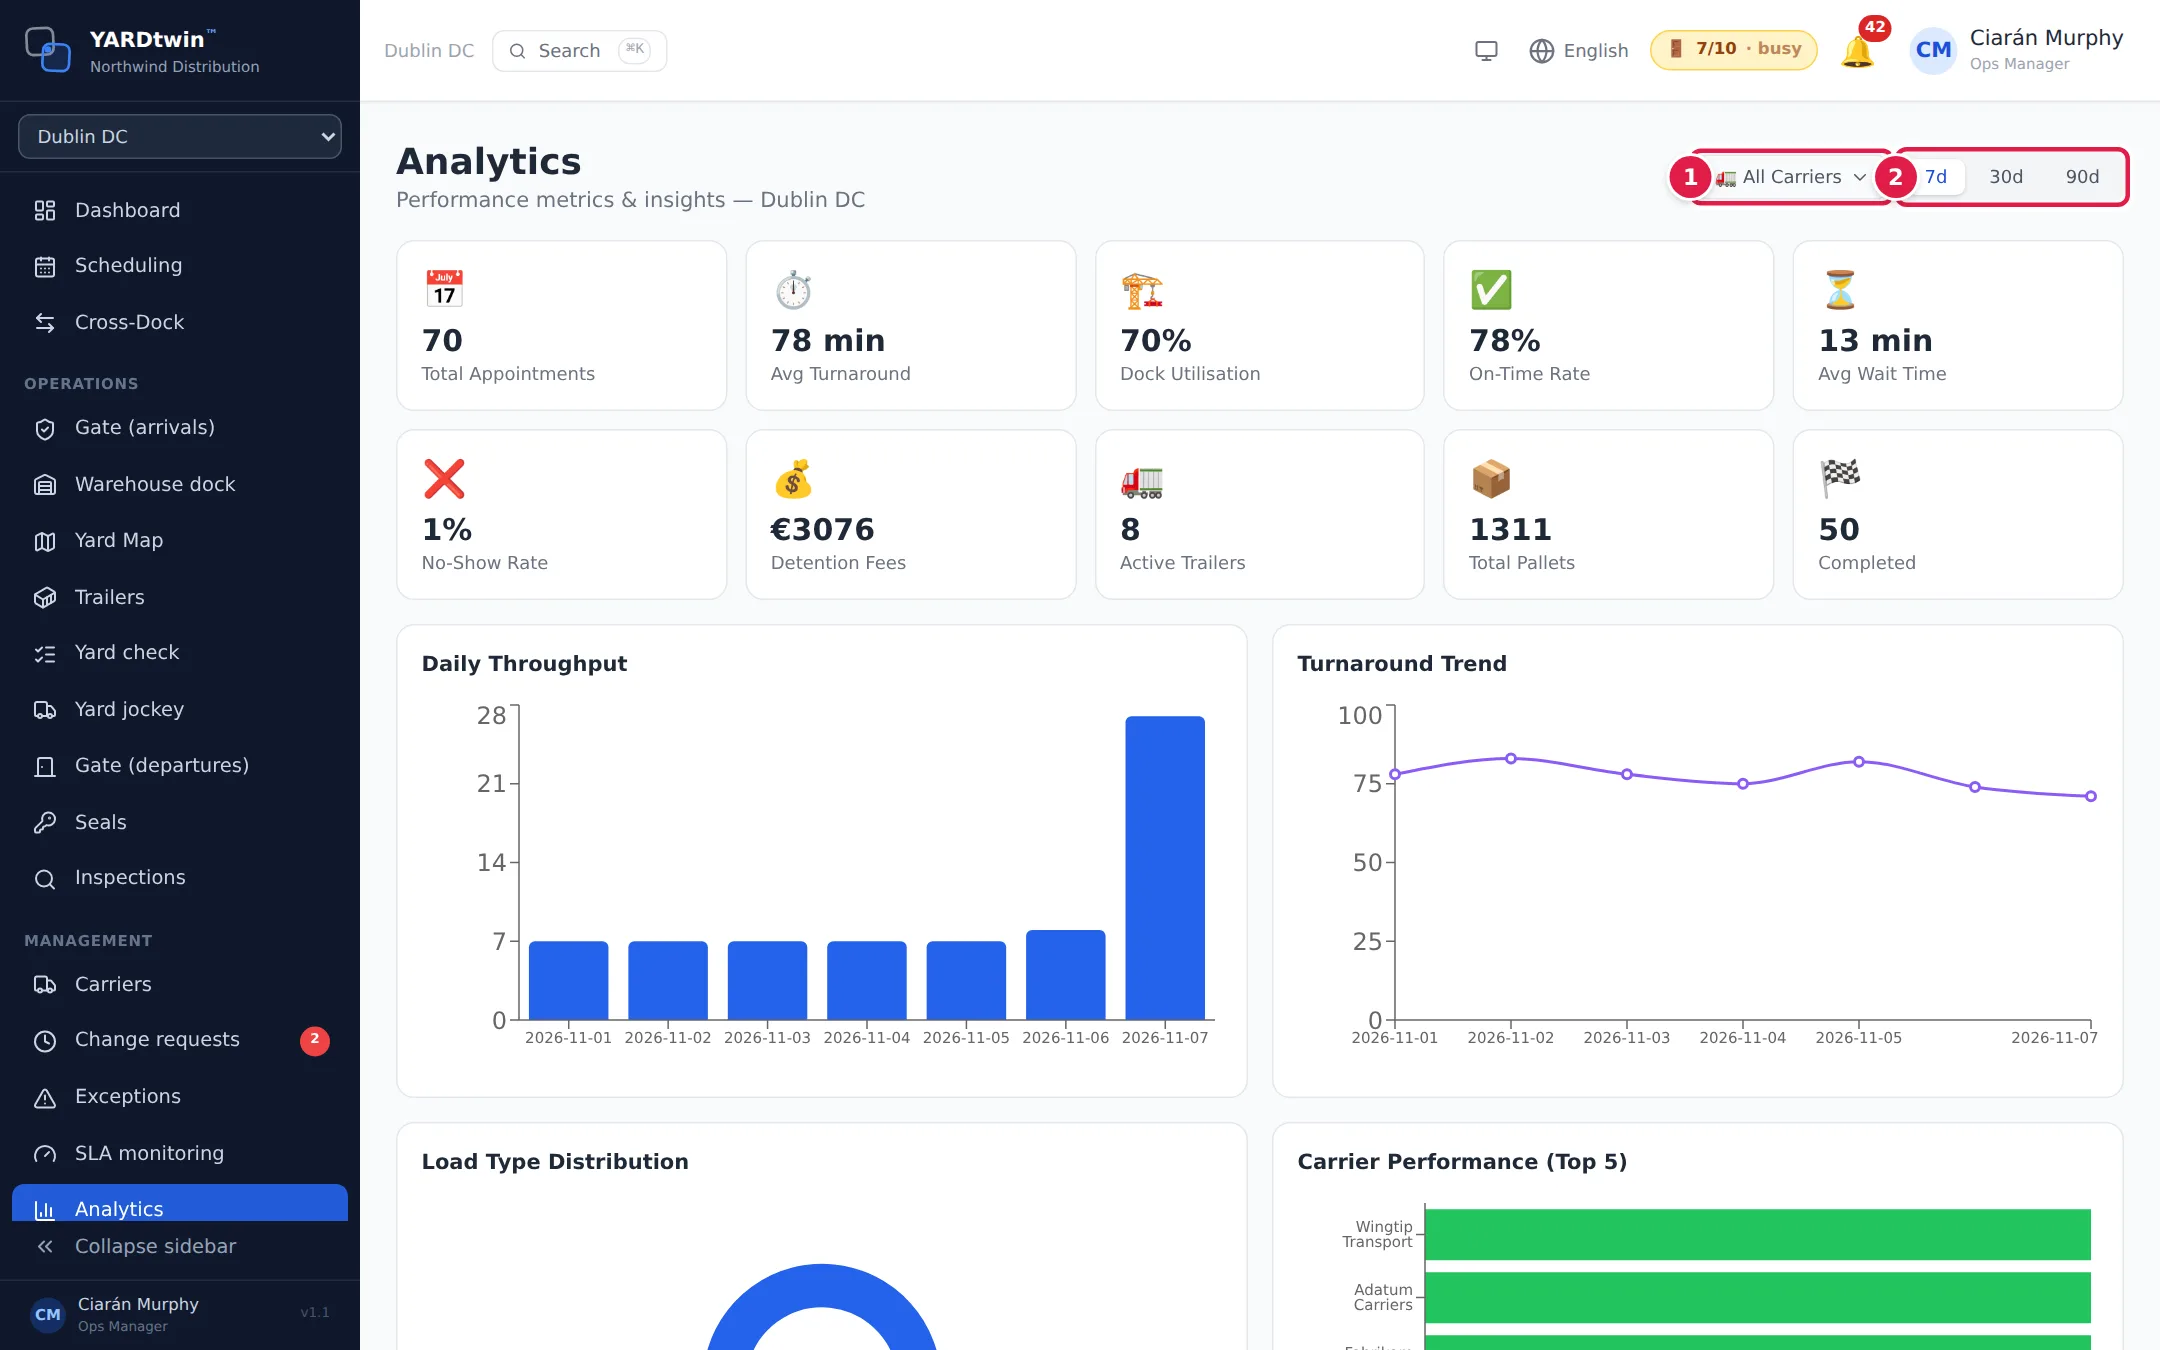
- All Carriers lets you tick one or more carriers, then Apply. The button then shows how many you picked, for example 2 carriers, and a blue bar shows that the page is filtered. Clear Filter removes it.
- Pick the period: 7d, 30d or 90d.
The page shows:
- KPI cards: Total Appointments, Avg Turnaround, Dock Utilisation, On-Time Rate, Avg Wait Time, No-Show Rate, Detention Fees, Active Trailers, Total Pallets and Completed. On-Time Rate shows — when there is nothing to measure yet, and 0% only when no truck arrived on time.
- Daily Throughput and Turnaround Trend charts, Load Type Distribution, and Carrier Performance (Top 5).
- Dock Performance: bookings, average turnaround, average load time and utilisation per dock. 📥 CSV downloads it.
- Hourly Activity: inbound and outbound bookings by hour.
- Carrier Breakdown: bookings, completed, no-shows, on-time % and average turnaround and wait per carrier for the period you picked, with 📥 CSV. On-time % is the dashboard's On-Time Arrival % for that carrier. — means the carrier has no completed visit with an arrival in the period; the CSV leaves that cell empty.
- Weighbridge Reconciliation (net vs booked), when the site has weighbridge readings. It compares each weighed load's net weight with the booked weight and flags the differences above the site's threshold.
- For administrators, ops managers, yard managers and operations staff: a demand forecast, a dock utilisation heatmap and a carrier league table. The heatmap's hours and days are the site's time. The league's on-time % is the dashboard's measure too, and its average turnaround and dock time cover every completed visit.
If something goes wrong
- "Choose fields or a grouping, then Run." Nothing has been run yet. Pick fields or a grouping and click Run.
- "aggregates need at least one groupBy column": an aggregate needs a Group by field. Click one, then run again.
- "This dataset is not available to your role": only administrators and QA can report on the audit log.
- "Save report as" opens when you click Export CSV or Schedule…: both need a saved report. Type a name, click Save, then click the button again.
- Export CSV is greyed out (viewers): open a saved report from the list on the left first.
- Fewer rows than expected: the preview stops at 200 rows. Save the report and use Export CSV for the rest.
- No Save button (viewers): ask an administrator, ops manager, yard manager or QA user to save the report for you.